Esta página solo tiene fines informativos. Ciertos servicios y funciones podrían no estar disponibles en tu jurisdicción.

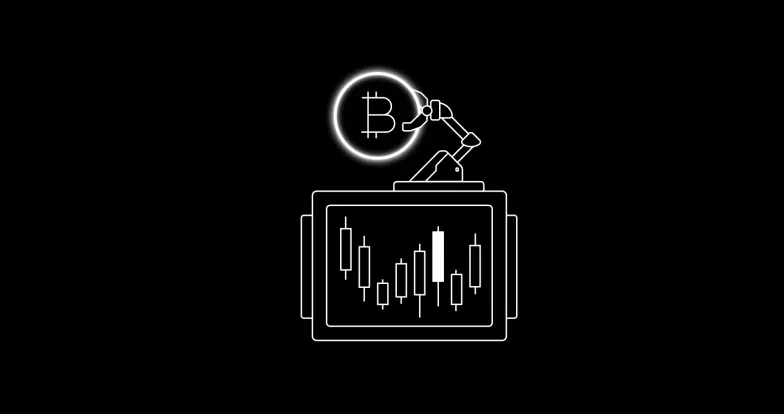
5 essential tools for navigating a bear market

During a bear market or crypto winter, the volume of FUD (fear, uncertainty, and doubt) can rise, spreading negativity across the space. Although caution is wise during a bear market, you may discover opportunities worth exploring. For example, the possibility of acquiring cryptocurrencies that were previously unattainable during a bullish period. A bearish drop in price could put an asset in reach and lead you to consider adding them to your portfolio.

With the above in mind, let's look at some tools to help you navigate a bear market.

🚩 Understanding the importance of the bear flag pattern

The bear flag pattern is essential for traders operating in a bear market. It signifies a potential price reversal in a financial market, characterized by a sharp decline (pole) followed by a period of consolidation (flag). Recognizing bear flag charts is valuable for traders seeking to enter or exit positions at the correct time. By understanding bear flag patterns, you'll gain insights into market sentiment and can make informed decisions about timing your trades and managing risk. Read more about the bear flag pattern in our article below. 👇

The ultimate guide to understanding and trading bear flag patterns

🕯️ Candlestick charts make price movements easier to understand

Candlestick charts play a vital role in bear market trading as they visually depict price movements across four price points. Using candlestick charts, you can analyze trends, support and resistance levels, and potential reversals. Understanding and interpreting these charts gives you valuable insights for making informed decisions and effectively managing your positions in the volatile crypto market. By providing a view back on past performance, candlestick charts can be effective in predicting future price movements, allowing you to optimize your trading strategy accordingly. Learn how to use candlestick charts by reading our guide below. 👇

How to read candlestick charts for effective crypto trading

🌀 What are bollinger bands?

Bollinger bands are important for traders in a bear market as they measure volatility and identify potential price trends. Developed by John Bollinger, these bands consist of upper, middle, and lower bands plotted based on moving averages and standard deviation. By using bollinger bands, you can make informed decisions, spot trend reversals and breakouts, and navigate the high volatility of the cryptocurrency market. Read more about Bollinger bands in our article. 👇

What are bollinger bands and how to use them for crypto trading?

🐂 Spotting bull flag patterns

Identifying bullish continuations in a bear market is crucial for traders as it provides insights into market trends and potential trading opportunities. Recognizing the bull flag pattern allows you to adjust your strategies, time your entries and exits, and effectively manage risk. By understanding this pattern, you can optimize your gains and minimize losses, making it an important tool for navigating the complexities of trading in a bear market. Read more about bull flag patterns in our guide. 👇

Bull flag pattern: a guide to trading bullish continuations

📈Top 8 indicators for crypto trading in 2025

Volatility brings both challenges and opportunities, if you're prepared. To help, we've compiled a list of the top eight indicators to assist you when a bear market arrives. These indicators provide a reliable and data-driven approach to trading, helping you navigate volatility using actionable insights. Read all about these indicators below and elevate your trading strategies. 👇

8 best indicators for crypto trading in 2025

Aviso legal
Este contenido se proporciona únicamente con fines informativos y puede incluir productos que no están disponibles en tu región. No tiene la intención de brindar: (i) asesoramiento o recomendaciones de inversión, (ii) ofertas o solicitudes de compra, venta o holding de criptos o activos digitales, (iii) asesoramiento financiero, contable, legal o fiscal. Los holdings de criptos o activos digitales, incluidas las stablecoins, implican un riesgo alto y pueden fluctuar considerablemente. Te recomendamos que analices si el trading o el holding de criptos o activos digitales es adecuado para ti en función de tu situación financiera. Consulta con un asesor legal, fiscal o de inversiones si tienes dudas sobre tu situación en particular. La información que aparece en esta publicación (incluidos los datos de mercado y la información estadística, si la hubiera) solo tiene fines informativos generales. Si bien se tomaron todas las precauciones necesarias al preparar estos datos y gráficos, no aceptamos ninguna responsabilidad por los errores de hecho u omisiones expresados en este documento.

© 2025 OKX. Se permite la reproducción o distribución de este artículo completo, o pueden usarse extractos de 100 palabras o menos, siempre y cuando no sea para uso comercial. La reproducción o distribución del artículo en su totalidad también debe indicar claramente lo siguiente: "Este artículo es © 2025 OKX y se usa con autorización". Los fragmentos autorizados deben hacer referencia al nombre del artículo e incluir la atribución, por ejemplo, "Nombre del artículo, [nombre del autor, si corresponde], © 2025 OKX". Algunos contenidos pueden ser generados o ayudados por herramientas de inteligencia artificial (IA). No se permiten obras derivadas ni otros usos de este artículo.

Artículos relacionados

Ver más
Bitcoin generic thumb
Bitcoin
Research

Comparing Bitcoin and S&P 500: charts and correlation to stocks

When it comes to building a portfolio for the long haul, traders often look towards long-standing, blue-chip stocks and exchange-traded funds tracking the Standard and Poor's 500 (S&P 500). Given their time-tested narrative and popularity among institutions, it's no surprise why such assets are top picks for anyone new to the world of traditional finance (TradFi).
5 sept 2025
Intermedio
16
Trading indicator generic thumb
Strategies

What is implied volatility: how IV impacts crypto option premiums

Did you know that you can still lose money when trading crypto options despite prices moving in your favor? That's due to the impact of implied volatility (IV) on option premiums. With highs and lows that you usually see on roller coasters, the implied volatility of and options can be tricky to navigate for anyone new to crypto options trading.
5 sept 2025
3
Trading indicator generic thumb
Technical analysis

What is relative strength index: timing crypto reversals with RSI

Timing the market is no easy feat. However, it can be made more manageable with technical analysis and momentum indicators like the relative strength index (RSI). As one of the more popular trading indicators in a crypto trader's technical analysis arsenal, RSI lets any trader immediately determine if a coin or token is overbought or oversold at a glance. Curious about the RSI indicator and mastering its ins and outs? From learning about what RSI is to understanding how RSI works, let's dive into the world of RSI and uncover how this momentum indicator can help you make more informed crypto trading decisions.
5 sept 2025
Intermedio
18
Technical analysis generic thumb
Order Types

What's a limit order?

A limit order instructs a broker to buy or sell an asset at a specific price. When you place a limit order, you essentially set a price limit for the transaction. The order will be executed if the asset’s price reaches or surpasses your limit price. However, the order will not be carried out if the market price exceeds your limit.
5 sept 2025
46
Generic charts thumbnail
Strategies

What is stochastic oscillator: gauging momentum with %K and %D

As a highly volatile digital asset that's available for trading on a 24/7 basis, the crypto market can be a difficult beast to tame for even the most experienced of crypto traders. That's where momentum-based trading indicators come in handy. The stochastic oscillator is one example of such a powerful technical analysis (TA) tool that focuses on momentum — a fancy way of saying how quickly a price is moving. By understanding momentum, you can gain valuable clues about potential trend reversals and identify overbought or oversold conditions.
5 sept 2025
4
Technical analysis generic thumb
Strategies

What are take profit and stop loss: crypto's fundamental risk management tools

Take profit and stop loss (TP/SL) are trading tactics that are meant to allow you to lock in gains or minimize losses as an asset's price changes. TP/SL are frequently used by traders of all experience levels to manage risk. If you're a beginner to cryptocurrency trading, it's worthwhile to understand how to use TP/SL as a fundamental stepping stone towards more complex . We're here to help.
5 sept 2025
Principiantes
273
Ver más